Soil series profile
Trinity soil series
Trinity is a moderately well drained soil with a clay surface, mapped on 412,526 acres in 42 counties across 5 states. Hydrologic group D.
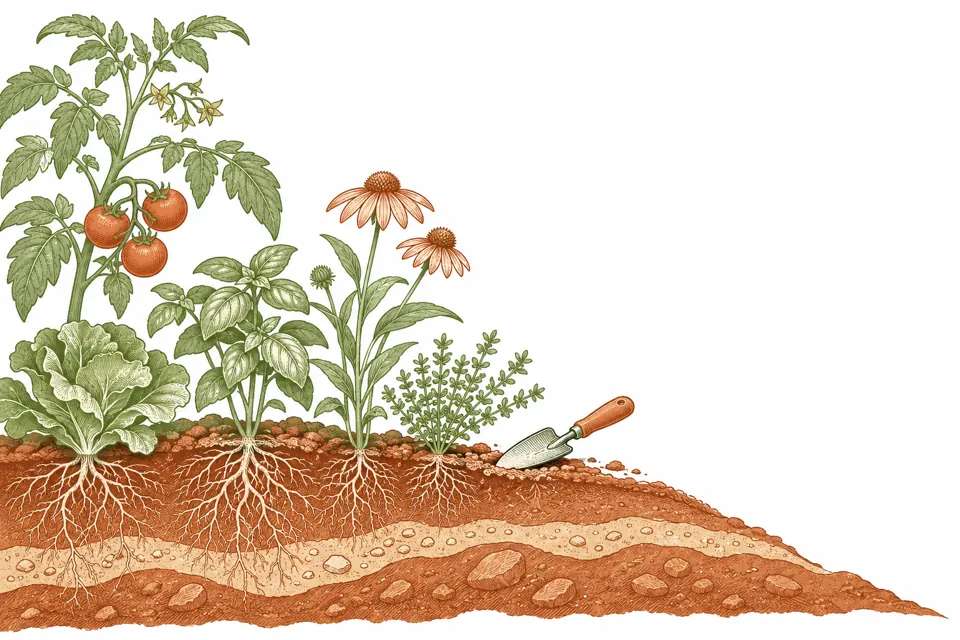
- Drainage class
- Moderately well drained 96% of mapped acres
- Hydrologic group
- D 98% of mapped acres
- Typical topsoil pH
- 7.9 moderately alkaline · range 7.6–7.9
- Mapped area
- 413k acres in 42 counties, 5 states
Typical Trinity profile
Texture and pH by depth
Show as a table
| Depth | Texture | pH | Clay | Sand | Organic matter |
|---|---|---|---|---|---|
| 0–6 in (Ap) | Clay | 7.9 | 70% | 9% | 2.5% |
| 6–16 in (Bkss1) | Clay | 7.9 | 70% | 9% | 1.5% |
| 16–80 in (Bkss2) | Clay | 7.9 | 70% | 9% | 1.25% |

What this means
What Trinity soil means for gardens, lawns and septic systems
For gardens
Typical topsoil in Trinity soils is moderately alkaline: pH 7.9 (most land between 7.6 and 7.9). Acid-loving plants such as blueberries and azaleas struggle without amended beds, and some trees and shrubs show iron chlorosis (yellow leaves with green veins).
Clayey topsoil covers 91% of mapped Trinity acres. Clay holds water and nutrients but drains slowly and compacts if worked wet: add compost, avoid tilling soggy soil and consider raised beds. The most common surface texture is clay (91% of mapped Trinity acres).
96% of mapped Trinity acres is moderately well to excessively drained, which suits most garden plants.
For lawns and yards
On >99% of mapped acres, rain soaks in slowly (hydrologic groups C and D, including dual groups that are D until drained). Expect runoff and puddles after heavy rain: core-aerate compacted lawns and keep ground sloping away from foundations.
A seasonal high water table comes within 18 inches of the surface on 31% of mapped acres, often in spring. Basements, sump pumps and lawns in low spots feel it first.
For a septic system
For conventional septic absorption fields, NRCS rates 91% of the acres in mapped Trinity soils very limited, 0% somewhat limited and 0% not limited (9% not rated, such as urban land, pits or water).
Where the soil is very limited (slow permeability, a high water table, flooding, shallow bedrock or steep slopes), alternative systems such as mound or sand-filter designs are common and cost more.
Flooding is mapped on >99% of the acres (33% occasional, 66% frequent).
Only a licensed site evaluation or perc test at the actual lot decides whether a system is allowed and which design.
Where Trinity soil is found
Mapped acres
Trinity is mapped in Texas, Oklahoma, Alabama, Arkansas and Mississippi.
| County | Acres | Share of county land |
|---|---|---|
| Navarro County, TX | 67,097 | 10.4% |
| Ellis County, TX | 57,923 | 9.6% |
| Dallas County, TX | 46,308 | 8.3% |
| Kaufman County, TX | 42,821 | 8.6% |
| Lamar County, TX | 20,067 | 3.4% |
| Delta County, TX | 18,725 | 11.3% |
| Henderson County, TX | 18,094 | 3.3% |
| Washington County, TX | 17,890 | 4.6% |
| Anderson County, TX | 15,440 | 2.3% |
| Red River County, TX | 13,997 | 2.1% |
| Choctaw County, OK | 11,767 | 2.4% |
| Austin County, TX | 11,259 | 2.7% |
| Freestone County, TX | 10,323 | 1.8% |
| Greene County, AL | 7,288 | 2.2% |
| Walker County, TX | 6,541 | 1.3% |
| Hunt County, TX | 4,712 | 0.9% |
| DeWitt County, TX | 4,508 | 0.8% |
| Rockwall County, TX | 4,163 | 5.1% |
| Waller County, TX | 3,329 | 1.0% |
| Tarrant County, TX | 3,215 | 0.6% |
| Wise County, TX | 3,026 | 0.5% |
| Atoka County, OK | 2,503 | 0.4% |
| Collin County, TX | 2,347 | 0.4% |
| Bryan County, OK | 1,864 | 0.3% |
| Colorado County, TX | 1,750 | 0.3% |
| Denton County, TX | 1,736 | 0.3% |
| Fayette County, TX | 1,615 | 0.3% |
| Victoria County, TX | 1,367 | 0.2% |
| Houston County, TX | 1,268 | 0.2% |
| Leon County, TX | 1,238 | 0.2% |
| Titus County, TX | 1,117 | 0.4% |
| Limestone County, TX | 1,092 | 0.2% |
| Hopkins County, TX | 985 | 0.2% |
| Little River County, AR | 839 | 0.2% |
| Montgomery County, TX | 830 | 0.1% |
| Burleson County, TX | 763 | 0.2% |
| Alcorn County, MS | 683 | 0.3% |
| Madison County, TX | 678 | 0.2% |
| Brazos County, TX | 524 | 0.1% |
| Morris County, TX | 353 | 0.2% |
| Wilson County, TX | 281 | 0.1% |
| Franklin County, TX | 200 | 0.1% |
Septic absorption fields
NRCS rating, share of Trinity acres
Show as a table
| Category | Share of acres |
|---|---|
| Not limited | 0.0% |
| Somewhat limited | 0.0% |
| Very limited | 90.9% |
| Not rated | 9.1% |
Drainage, water table and flooding
Share of Trinity acres
- Depth to seasonal high water table
- About 1.5 feet (18 in) (median where reported); within 18 inches on 31% of acres.
- Flooding
- Mapped as flooding on >99% of acres (33% occasional, 66% frequent).
- Slope
- Typically 0–0% (median 0%).
- Topsoil organic matter
- Median 2.5%.
Drainage class
Show as a table
| Category | Share of acres |
|---|---|
| Excessively drained | 0.0% |
| Somewhat excessively drained | 0.0% |
| Well drained | 0.0% |
| Moderately well drained | 95.7% |
| Somewhat poorly drained | 4.0% |
| Poorly drained | 0.0% |
| Very poorly drained | 0.2% |
Hydrologic soil group
Show as a table
| Category | Share of acres |
|---|---|
| A: fast infiltration (mostly sandy or gravelly) | 0.0% |
| B: moderate infiltration | 0.0% |
| C: slow infiltration | 0.0% |
| D: very slow infiltration (clayey, shallow or wet) | 97.6% |
| A/D: D as is, A if drained | 0.0% |
| B/D: D as is, B if drained | 0.0% |
| C/D: D as is, C if drained | 1.8% |
| Not rated | 0.6% |
Sources & data dates
- Source
- USDA NRCS Soil Survey Geographic Database (SSURGO), queried through Soil Data Access. Public domain.
- Data date
- SSURGO as published on November 3, 2026 (most recent survey area update October 26, 2026). NRCS refreshes SSURGO each October.
- Scope
- All map unit components named Trinity (component kind "Series") in SSURGO: 412,526 acres.
- Method
- Shares are by mapped acres of Trinity components. The profile comes from the single largest Trinity component. Full methodology.